Locking down the economy to save lives in a pandemic comes at the cost of unemployment, but how much, is the issue. Measuring that unemployment in Australia has been the focus of much dissent of late, in both social and mainstream media. The variations post-COVID have been extreme and rigour in methodology and measurement primarily abandoned.
Headlines like the ABC’s “Almost a million Australians out of work due to coronavirus; RBA tips economy to take 10pc hit”, are common. The Reserve Bank and Bankwest Curtin Economics Centre asserted similarly, “unemployment rate will rocket from 5.1 per cent past the 1992 high of 11.1 per cent as quickly as August before hitting 12.7 per cent in May 2021.”
ABS instability
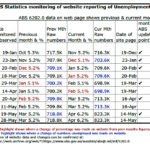
Meanwhile, the underfunded and understaffed ABS produced statistics on unemployment that needed readjusting between January and May of 2020. Between 5.1% to 5.2% for any given month, raising or dropping unemployment estimates month to month anywhere between 5,500 to 10,900. The month of February shifted from 689.9K (5.1%) on the 19th of Mar by an additional 10.9K to 709.8K (5.2%), by the 16th of Apr. The adjacent chart shows the other four adjustments. Data accuracy was problematic under Covid-19.
Apparently, the ABS had stopped surveying the whole of March during the lockdown. By the 14th of May, the ABS announced that unemployment had only risen from 5.2% (718.8K) in March to 6.2% (823.3K) in April. No trend estimates for April were released, despite being widely perceived as an underestimate. If this is to be considered valid, then this constituted a percentage of drastic unemployment which had previously been unseen, … since September of 2015 – when it was last 6.2%. In the middle of a Pandemic with apparently massive job losses, we were expected to believe it was as “catastrophic” as most of 2014 & 2015. Although if you look back far enough, it was much worse (as unemployment exceeded 6.2%) in the first half of 2003, back as far as the time ABS kept records, using the redesigned sample methodology developed, back in 1992.
6.2%? REALLY?
To everyone’s surprise, a certain level of healthy scepticism has arisen about the ABS statistics. There were dozens of social media posts that bandied the “one hour a week” rule for defining employment, as a criticism.
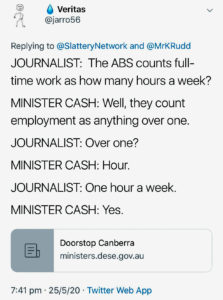
The idea that “anything over one” hour a week constitutes “employment” arose from a question raised by a journalist to Michaelia Cash. The reaction to Cash’s “one hour a week” measure of employment is problematic because neither was, the question well-posed nor the answer, accurate. The problem is the “one hour in a week” rule is a misnomer. Statistically, that is true of what is known as the “reference week”, BUT the ABS also takes regard of the four weeks before the end of the reference week. So “what counts as full-time work” is not measured in any one week, neither do they count your work history for only a week. Besides, no one works for merely one hour a week as Greg Jericho is quick to point out. It is far more likely the minimum is at least a single work shift a week. Although, Greg’s focusing on the “one hour a week”, ignores the other points of exclusion.
You also have to be actively looking for work during those four weeks to be counted as unemployed. Other exclusions include working without pay in either a family business or farm during the reference week. Steve Keen in “The Australian”, of all places:
“Herein lies the problem with spin in economic data: sometimes the spin turns your way, sometimes it doesn’t. The ABS uses the internationally sanctioned definition of unemployment, which is similar to Tom Waits’ definition of being drunk: you have to be really, really out of it to qualify. Not only must you not be in employment, but you can’t have done even one hour of paid or unpaid in the four weeks prior to the survey. Nor can you be discouraged by the absence of available jobs either — you must have applied for something in the previous four weeks — and you must be available to start immediately.”
This explains why – for the ABS – unemployment is only 6.2%. The Lockdown by Scott Morrison announced on the 13th of March began on March 16th – after his Church’s Pentecostal conference was over. Closures of pubs, clubs, cafes and restaurants weren’t mandated till the following Monday. Further closures of Auction houses, real estate auctions, eating in shopping centre food courts, amusement parks, play centres, etc., were not decided on, till later that week. Wage subsidy packages were decided on, by the end of March.
So, given people have to be unemployed for four weeks to begin to registering to the ABS as “unemployed”, many former employees, would not have even been designated as “unemployed” in April. Also one needs to factor in, that Jobkeeper “hid” people who were later fired in April or thereafter.
International vs domestic
The ABS unemployment methodology is often criticised for the wrong reasons. What people don’t understand is the methodology championed by ILO that ABS has a context – international comparisons. That is the correct context. The “I” in ILO stands for International not Intra-national.
As a stand-alone domestic measure, it is fundamentally flawed—realised by the concession that there is an element of “hidden unemployment” that is not measured by the ABS methods. There is also a concept of “discouraged job seekers” and “underutilisation”. All these additional descriptions are an admission that the ABS does not wholistically measure Australian unemployment. The ILO standard was never designed to be used to measure the internal or domestic unemployment of any country. Alan Austin often uses ABS statistics to compare nations but continues to demonstrate that, there is more to Australian unemployment than just the 5+% the ABS has been claiming in recent years.
Australian Domestic Employment
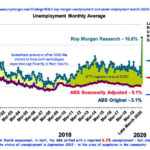
The ABS does not adequately measure real domestic unemployment. The government frequently engages with these measures to deceive the public as to the actual extent of domestic unemployment. This is where the non-internationally comparative Roy Morgan’s statistics should be used. They are a far more accurate measure of real domestic unemployment in Australia. Roy Morgan is quite capable of defending its methodology. Comparing Roy Morgan and the ABS shows that the ABS has become increasingly misaligned.
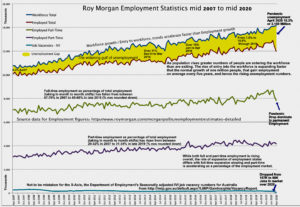
Charting Roy Morgan’s employment statistics for over a decade and adding the Department of Employment’s IVI statistics for job vacancies reveals several long-standing trends.
- Full-time work has been falling as a portion of Employment in Australia, and Part-time has been rising.
- The rate of entry into the workforce is not matched by employment growth. Unemployment now at 15.3% from 6.3% in April 13 years ago as illustrated by the gap between workforce and employment.
- There have never been enough job vacancies to fill the unemployed’s needs for work.
- There was no robustness in the economy for jobs to survive any emergency that might disrupt it.
This graph shows a stark drop in full-time employment when pandemic lockdown occurred, but not so for part-time employment. While these are early days to track significant reductions, there is another explanation.
Corporation’s human capital is often hard and expensive to acquire. Expertise that marches out the door from an enterprise can be irreplaceable, especially in high-end jobs. Drilling down into the IVI stats for job vacancies reveals numeric disparities between entry-level jobs and highly skilled positions.
The combination of managers, professionals, technicians, social workers, clericals, etc., represent the largest portion of job vacancies whereas Labourers, Machinery operators, Drivers and low skilled jobs are a much smaller proportion. I’ve outlined these proportions previously via Anglicare’s Jobs Availability Snapshot.
Shifting full-time workers to part-time helps employers retaining critical staff when their business recovers. The ACA promoted this as an option for keeping staff, and the JobKeeper legislation enables that approach.
Australian Under and Unemployment
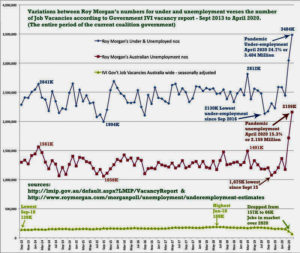
Still, where is our recovery going to come from when you consider the figures of this graph on under and unemployment and job vacancies? Consider:
- Given the enormity of under and unemployment (24.7%), how can our economy recover?
- Given the trend in falling job vacancies to less than half what it was at the beginning of the year, from where is employment going to come?
- Given Australia has been in a per-capita recession since late 2018 where is the pre-existing economic robustness for a functional recovery?
-
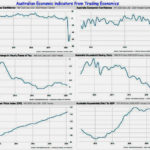
Poor economic indicators for Australia leading into 2020 Given the previous falls in business & consumer confidence, Wage rates and household saving, and rises in CPI, Utility pricing, through household debt where is the cushion for a soft landing?
The methodology for unemployment measurements during the great depression of the 1930s was different from how we measure today. Pointing out that Unemployment reached a record high of around 30% in 1932, is problematic as we are not using comparable measures. That hasn’t stopped the media from making the comparison, and it is not that far fetched, given the enormity of the problem.