How is it that recent parliamentary bloodletting over tax breaks and electricity pricing continues to detract from steady planetary exsanguination? Are we now to accept that farm tours, milk levies and infrastructure spends are to be the ready tourniquets for our Australian economy? The political focus on Tax breaks to increase wage rates while the world’s climate renders economics a mute subject, for a planet less habitable, is a distraction we probably can’t afford long-term. The political rhetoric around these subjects is diversionary, and there is little truth expressed in the alleged relationships between these subjects.
Employment
Let’s keep Australia working
The Liberals who cut penalty rates, public services, and taxes for the corporates, have come up with a slogan to replace “Jobs and Growth”. The slogan is, “Let’s Keep Australia Working.”
The implication being a vote for Labor is a vote against your job. The question we need to ask is: “Has the liberal agenda succeeded in keeping Australia working or are jobs and wages diminishing?”
Full-time / Part-time
In October 2017, Michaelia Cash promoted job growth as she claimed “371,500 jobs created over the last year, 315,900 were full time“. Referencing the ABS’s next month’s stats, Malcolm Turnbull later said: “New data shows another 61,600 jobs were created in November, lifting the number of new jobs this year to 383,300.” That may sound convincing and consistent. Of course, as other authors such as Alan Austin note, it is all a matter of strategically timing your announcement, so the figures fit your case. For example, choosing a month where historically low employment featured the previous year to be compared with a better statistic this year. A slightly different choice of month or period produces different results. Statistical variations depend on the accuracy of the collection methods; underlying definitions of employment, and what dates are being compared. The ABS statistical methods for employment issues have come under considerable criticism even from within its ranks. The ABS, although, does not engage in any statistical tampering or deception on behalf of the government. ABS methodology follows the ILO international protocols for measuring unemployment, although the methodology does have its faults.
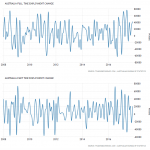
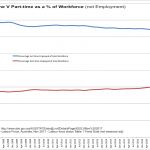
Monthly deviations in Full-time employment and part-time employment are significant, and cherry picking dates can be misleading. Depending on what is your starting and ending point you can show either rising or falling employment. What is notable is the increasing volatility of employment markets over the years.
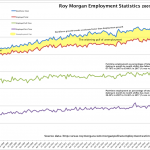
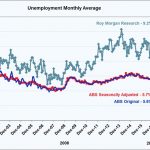
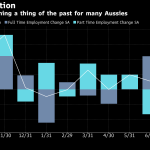
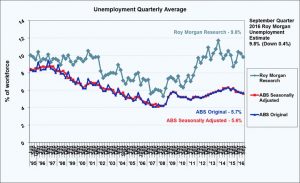
So are there alternative measures which use alternative criteria for measuring employment? Roy Morgan’s measurements are considerably more modest than the ABS stats that Michaelia Cash and Malcolm Turnbull referenced. Their numbers for November 2017 report show long-term job expansion is in part-time jobs, with declining full-time jobs. The figures provided, show that full-time employment decreased 31,000 in the last year till November whereas part-time employment rose by 70,000.
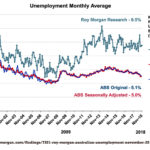
Roy Morgan’s measurements for employment and unemployment differ considerably to the ABS’s methodology for a few fundamental reasons. Morgan’s take on part-time and full-time employment also depicts it as volatile. Morgan shows that part-time employment is growing faster than full-time as the job market is becoming increasingly casualised. A point with which even the RBA agrees. Graphing these statistics over the last ten year shows a clear trend which the ABS methodology obscures while Roy Morgan’s method makes it easier to track. This methodology is also notable for tracking under-employment, or what the ABS calls “hidden unemployment”.
Employment numbers have risen, but so has the total labour workforce seeking or occupying employment. The problem is that unemployment and underemployment according to Roy Morgan’s stats were 2.394 million people in Nov 2017 (18.2%). Combined underemployment and unemployment haven’t been consistently below 2 million since 2011. One has to dig through ABS’s statistics for their underutilisation figures to see a similar pattern. Roy Morgan reports 9.8% unemployment, and for ABS it is 5.4% in November 2017. Using percentage figures in a growing labour force can be inherently deceptive. According to the ABS, our unemployment rate in Nov 2017 is at 5.4%, and the last time it was that rate was in February 2013. But in February 2013, that represented 660,000 people. By November 2017 5.4% is 708,000 people. Taking Roy Morgan’s unemployment figures for Nov 2017, we have 9.8% or 1,288,000 people. The last time we were at 9.8% in a similar period to ABS’s 2013 figure, was August 2012, where 9.8% represented 1,205,000 people. In essence, 5.4% or 9.8% in 2017 isn’t equivalent to 5.4% or 9.8% in late 2012/early 2013. Whichever statistical methodology you reference, our labour market is worse off regarding raw unemployment numbers, casualisation, and volatility than we were under Labor’s administration.
Working Hours
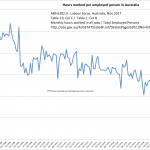
But what about the hours worked by those who are employed? It would seem self-evident that if part-time work was rising faster than full-time, that hours worked would be reducing. It has long been the thesis of writers such as Alan Austin. I took a slightly different track with ABS data and charted hours worked as a function of just those employed, rather than demonstrating as Alan does, that working hours available for the Adult population is decreasing. In spite of how you look at it, it is evident that adequate working hours are less accessible both to employed and unemployed.
Job Vacancies
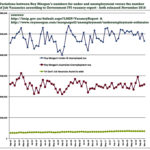
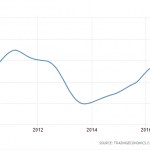
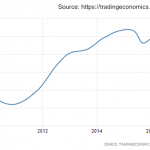
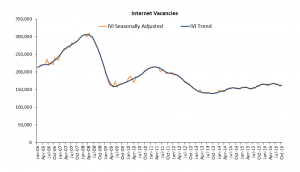
Job vacancies in comparison to unemployed job seekers have also been problematic. While there has been a soft rise in vacancies available over time – since the coalition came into power – it has been far below any measure of unemployed numbers (no matter the method). The job vacancy rate for the entire continent of Australia from the government’s IVI index for November 2017 was 177,900. In the four years of the coalition government, it has never risen above 180K and has been as low as 150K. Now to be fair, not all vacancies (although most) advertise online. The ANZ, although, regularly tracks job advertisements saying “Job ads growth was 3.7 percent year-on-year in December, a steep fall from 6 percent in November. In trend terms, the numbers looked a bit better at 4.7 percent year-on-year, but this was down sharply from 9.4 percent annual growth in early 2016.” So let’s factor in these adjustments. Fortunately, Trading Economics has already done this, reporting “Job Vacancies in Australia increased to 201.30 Thousand in the third quarter of 2017 from 189.20 Thousand in the second quarter of 2017“. Despite the increase, 201K job vacancies hardly make a dent in 1,288,000 unemployed people let alone 2.394 million under-employed and unemployed persons seeking jobs in Australia.
Wages
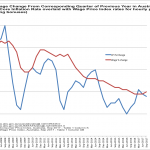
Well, at least the employed get paid, you may – in the resignation of these dismal statistics – sigh. Therein the news gets worse. Wage rate growth continues to stagnate, to levels unseen in this century down as far as 1.9% in the previous quarter. While there is still growth, the question needs to be: Is the growth rate keeping up with that of the CPI? The answer on the surface is “barely”. ABS statistics graphed here show that it is predominately keeping its head above water. The CPI is widely criticised for “excluding home purchase costs“. In a country where private debt towers over GDP by 122% and housing affordability limits access to homes, this is a significant omission. “The ABS does produce cost of living indices which consider the cost of living according to your source of income – wage, pension, or government benefits“, states the Guardian’s Greg Jericho. Once you add the real cost of living factors, you will quickly realise wages are not keeping up with the actual costs of living.
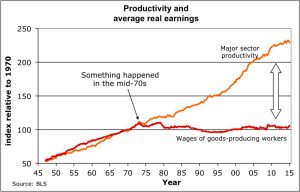
Despite the falling wage growth rates, productivity has been expanding by all indicators. One would assume if the nation is being more productive that wages should rise accordingly. So the claim by the Prime Minister has turned from claiming the lack of wage movement is a function of a lack of security and productivity to being “blamed [for] a lack of economic demand“, despite later boasting about Australia’s economic growth. It would appear the government’s excuses change from month to month and assume nobody is keeping track. So despite fewer hours available collectively for the employed, and reducing wage rises, the level of productivity in the country has been rising.
Job Losses
Job losses for specific industries under the instigation of the coalition will have long-term consequences for our economy. Some of these include:
- Abbott and Hockey’s dismantling of the car manufacturing industry in this country for a preference for imports from China, Korea and Japan saw the end of jobs for thousands of workers with estimates from 90K to 200K losses. Hockey had admitted in Parliament that “Ending the age of entitlement for the industry was a hard decision, but it needed to be made because as a result of that decision we were able to get free-trade agreements with Korea, Japan and China.’’
- The government continues to seek means to support a diminishing mining industry and supply $1billion to Adani Mine. Mining employment is contracting, but it is being promoted at the cost of a tourism industry that employs more than twice the number of people. The tourism sector has the more significant potential for job creation than the mining sector.
- The coalition has overseen one in ten public servants losing their jobs, while spending on consultants has risen by $300 million. Amongst those civil servants, the tax department has divested itself of 4400 employees and their expertise in keeping tax avoidance in check, so private companies could stash money overseas whether acquired via profits or tax cuts rather than use it to employ more people in Australia.
Foreign Workers
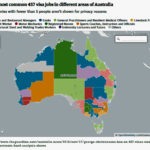
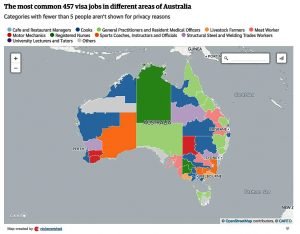
There are 37 Visa sub-classes available for a foreigner to work under in Australia of which the 457 sub-class received significant notoriety. As at the end of 2016, there were 95,758 people in Australia who had that visa. That sub-class is being replaced by two separate classes – as announced in April of 2017 – for the future, so tracking worker visas will ultimately be more complex from here on in. Consequently, as a result, the 457 class numbers will naturally begin to shrink which will no doubt be a talking point for the government from hereon.
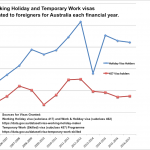
The lessor referenced 417 and 462 Class of working holidaymakers has had 63,988 visitors granted with working rights last year up until September of 2017. Mapping these three visa classes over the last decade gives one a perspective of for whom the government focusses on “keeping working”.
Now to be fair even if all these people left tomorrow it would still not have a significant impact on unemployment and not simply because the numbers are “low” relative to the numbers of unemployed. As usual, it is nuanced, and for a greater understanding, I have written on this at greater length here.
Conclusion.
It is, although, evident that the claims by politicians about their success in managing an economy that has produced employment is highly subjective and lacks credibility. Whatever the coalition is doing, it is NOT keeping Australia working.
457 to?
“We are bringing the 457 visa class to an end”, announced Mr Turnbull after Easter, “…We will replace it with two new temporary skills visas.” With a quick sleight of hand, Turnbull re-branded the much criticised 457 visa with two – as yet unnamed – programs to bring foreign workers to Australia. Though new rules and security checks were mentioned, he ensured that he would guard us against the impending “threat of permanent citizenship” of intelligent and skilled foreigners whom our employers have sought out. Rest assured, Turnbull has proclaimed he will keep us safe from having people of this calibre, stay in Australia.
As Australia returned to work after the Easter long weekend, Malcolm Turnbull reminded us we were a nation of immigrants, but we should not be overrun by too much more. With the Australian workforce apparently foremost on his mind, Turnbull told the nation (first via Facebook) that the 457-visa program was being scrapped for two new innovative temporary foreign worker schemes to tackle our unemployment issues. In restricting that program and although unnamed, he proposed two new visa programs with fewer job role options, new market tests, English language, skills and experience requirements.
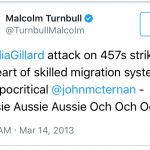
The first reminder that comes to the fore concerning these new reforms that “put Australian’s first”, is a reference to the similar policy I’ve previously heard. Didn’t Julia Gillard propose something similar herself in 2013? Didn’t Malcolm Turnbull criticise her for striking at the “heart of the skilled migration system”?
457 in decline?
Leaving Turnbull’s change of perspective aside, the numbers of 457 workers in Australia have been a subject of much speculation and false rhetoric by politicians seeking to introduce alternative facts and in some cases, outright bigotry. 457 visa numbers have been following a pattern of decline in the last few years but a significant aspect of that in the annual cyclic pattern.
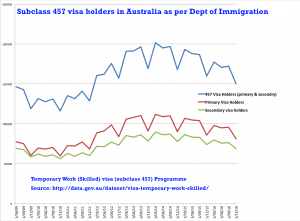
Regarding the 2016 decline of numbers in Australia in any quarter – providing you limit your scope – it looks significant. The first quarter of 2016 (March) there were about 177,390 people in the country working under 457 visas.
Since then it dropped slightly to 170,580 (June), up a little to 172,187 (Sept), and dropped significantly to 150,219 (Dec). Now, while these last figures may create the illusion of a significant fall, you need to look at the seasonal pattern of numbers over the last few years. Stepping back and reviewing the last seven years, a pattern emerges for every year. (Rising sharply, slight fall, slight rising, sharp decline) The pattern – as graphed here – will show you that it is about to jump back up again, so there is a deception inherent in quoting the last quarter’s figures of any year as indicative of where 457 numbers are or will be. 457 visa data have a predictable annual cyclical pattern. Turnbull’s timing made before the Department of Immigration released the last quarter’s figures creates the short-term illusion in media reporting that the coalition is indeed clamping down on 457 workers.
Workers come and go. Totals expressed in net movements of visa entrants – over periods such as a year – hide the significant seasonal change in numbers in the country. So when it is stated that 33,340 of the 40,100 primary applicants lodged 457 visa requests in the first quarter of 2016 were successful and that this is a decrease from the same time last year, what is notably absent is how many 457 workers left. This is also dependent on which quarter you choose. So pointing out that – during the third quarter of 2012 under Gillard – that 35,452 foreign workers entered the country, ignores that only 14,665 came in the last quarter of 2009. The coalition cherry picking numbers from specific quarters to disparage Rudd/Gillard’s record – that in actuality had both the highest and lowest intake of 457 Visa workers – is perhaps a tad disingenuous.
Annual cycle aside, it is still true to say the average number of 457 workers in the country since the coalition took power has been larger than the number of government recorded job vacancies in Australia. To keep it in context, the last 457 worker totals released by the Immigration department said there were 165.9K vacancies in Dec 2016. 457 workers had done their customary annual December quarter drop to 150K, down from 172K in the previous quarter. Unemployment at the time (Roy Morgan’s figures) was over seven times that amount at 1,186K or 9.2%. If you added Morgan’s December underemployment numbers to the unemployment, then you reach a number nearly 16 times the vacancy rate at 2,584K. I am not going to entertain the ABS figures because of their inherent inaccuracy.
So even if you threw out all the 457 visa holders in December representing less than 1% of the workforce and made all their jobs available, it would have little impact on the 2.5 million both under and unemployed. This is particularly the case, as the presumption is there are no available Australians in the market who have the skills necessary to fill these roles. This begs two questions.

- Why is it so?
- Is it so?
Why 457?
Introduced by John Howard in 1996, the 457 Visa program has been beset by concerns about fraud, corruption and need. Fraud, we will get back to, but the need for it is still a failure of policy. Howard claimed it was to enable employers to address labour shortages in the Australian market and yet after 20 years; we still need to address skill shortages? You’d have to wonder after 20 years, about an economy and a national policy framework that has so failed to raise the skill levels in Australians, that we still need 457 visa workers. How is that “in the national interest” as Mr Turnbull so frequently repeated? A medical degree takes 6yrs, engineering 5yrs and a commerce degree 3yrs. So what has the government been doing for the last two decades? Why have we been unable to educate and upskill our population? Why is this foreign labour market even necessary? To answer that, we need to go back initially to Howard and ask how he began to prepare our children.
As a western nation which once boasted of free education for its population, the growing restriction of education to the people has had consequences for our labour market. Howard changed how education was funded by allocating considerable funding to private schools and undercutting public schools. Students drifted away from public schools to the better-funded private schools, where they could afford the luxury. The public education system retained a community of poorer demographics with less time or capacity for higher education and an increasing inequality of educational results. The social class division between the affluent and the underprivileged then began at school for children. Two decades later the Program for International Student Assessment (PISA) survey shows Australian children falling behind in education. Segregated our schooling system by either academic or social class boundary have been largely to blame for our children’s poor performance. Our ranking for investment on the OECD league tables for education is 22 out of 37 1n the OECD. Small expenditure is followed by weak results.
Whitlam onwards.
Leaving high school for TAFE or University has done little to revoke the class distinctions established by Howard’s redistribution of education funding. Whitlam abolished fees for TAFE and university students and provided support for apprenticeships through the National Apprenticeship Assistance Scheme (NAAS). Hawke reduced funding and re-established costs to students as well as changing labour market programs around apprenticeships and introduced traineeships as a significant response to rising youth unemployment. Trade apprenticeships flourished as the government focused on traineeships. Mr Keating started governments down the neo-liberal path of privatising the public sector. The problem with privatising the public sector was that these were the main generators of apprenticeship training such as electricity utilities, telecommunications, defence industries, rail, roads, and Australian airlines. Howard also continued to undermine the public sector which contributed to a reduction in skills training – via public sector apprenticeships. Howard quickly consolidated apprenticeships and traineeships under a single umbrella and wrested it away to unions and into the hands of employers. Skewing support for apprenticeships profoundly in the interests of employers was followed by a decline in training delivery, apprenticeship completions, pay and conditions. None of which was aided by the further dismantling of the industrial relations system, through the introduction of enterprise bargaining. While Rudd and Gillard dismantled Howard’s “work choices”, they still followed the traditions of the Hawke/Keating legacy by “make[ing] concessions to the big mining companies, reduc[ing] corporate tax, and restrict[ing] unions rights and push[ing] through spending cuts to maintain a budget surplus.” The decimation of manufacturing under Abbott destroyed yet another training base for trades and reduced the intake of apprentices. The budget cuts of his administration also severely impacted apprenticeships. Tracking the causes, consequences and level of damage to our employment economy have been made all the more complicated by Abbott’s savage dismantling of expert advisory panels as compiled by Sally McManus.
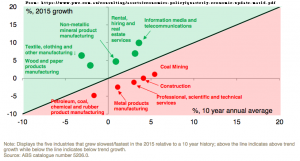
The combination of factors including the dismantling of education, expert advice, the industrial relations system and the public sector meant that a four-year apprenticeship in the building trade gets replaced by a shallow sixteen week CBT course as the bare minimum for that particular role. The results were described as “a disaggregation of skill which is ‘modularised’, ‘flexible’ and ‘atomised’ … [that] will ultimately leave skills ‘fragmented’ at their core.”
Many apprenticeships as a means of training up in skills for increasing levels of youth unemployment have mostly vanished by comparison. For example, Federal funding for NSW Tafe reached it’s zenith in 2011 and after that decreased. Deregulation of training provision meant funding to non-TAFE, and private providers increased by 20%. The consequence of this produced the rise of dodgy private providers of vocational education and also the unscrupulous practices by some private providers which have become a scandal in Australia.
Add too, what Abbott euphemistically referred to as “Fee Deregulation”. Attempts to rectify the class based education system via Gonski funding were scrapped, and the vocational training sector simply received new student loan systems, all of which has done little to encourage Australians to “buy” education. The result has been a drop-off in the teaching in Australia as students fall by the wayside, get ripped off or – even if they do complete their degrees – are faced with indexed debts that limit their employment capacities. All this in a market of decreasing full-time jobs, low vacancies and huge competition from other under and unemployed members of the workforce. Skills shortages have been a function of deteriorating access to Education driven by political policy.
Is there a skills shortage?
It is, of course, true to say we do have skill shortages. The question as to what extent any occupation is genuinely suffering from a talent shortage – is problematic. Questions arise as to whether the request for that skill just represents an opportunity for an employer to take advantage of a compliant, cheap and de-unionised workforce. Most reports whether from Flinders University or the National Institute of Labour studies have all rather reflected the opinion of the Flinders University report that “Despite the attention paid to skill shortages, the evidence used to evaluate their incidence and the causes and responses by firms remains thin.”
The problem predominately is that the labour market testing for skills shortages will still be conducted by employers – not by an independent panel. Employer “testing” will do nothing to affect the corruption at the core of exploitation of 457 workers.
Turnbull has announced that 216 job roles that are not covered by the renamed 457 visa scheme. The problem is that Turnbull’s new visa jobs list would affect just 9 per cent of the current 457 visa holders. So mostly he has cut an already redundant list of skills requirements – at least a quarter of which have had no application for in the last year. Turnbull has not addressed the issue of employer rorts because the determination of a genuine skills shortage has been so easy to defraud. Underpaying 457 workers has been pervasive amongst dishonest businesses.
In the absence of a plan to rectify education, the public sector, independent labour market analysis, unemployment, jobs and growth Malcolm Turnbull’s reinvention of the 457 visa scheme does little to aid Australia out of the economic malaise. Without attention to this issue now, we’ll be obsessing over skill shortages and “temporary” foreign workers in another twenty years.
Debt Collection
Centrelink has been fraudulently issuing debt notices to people who owe no money. Persons so identified are then harassed and threatened to the point that they pay this un-owed debt rather than being penalised by a system, which they already know actively disparages them.
Labor’s Anthony Albanese, while being concerned about this government’s debt collection said, “No one would argue [against] that if someone has a debt from Centrelink, had payments to which they were not entitled, then it should be repaid“. I would argue to the contrary.
The Poverty of Welfare.
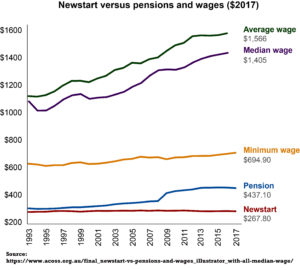
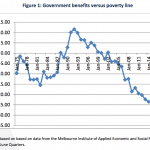
Centrelink’s services exist to ensure the disbursement of social security payments whether that be for unemployment, or aid for families, carers, the disabled or indigenous. That financial aid in many cases has rarely increased, and in some has decreased in terms of CPI value. In the case of the baseline unemployment benefits, though indexed to the CPI, “there have been no legislated changes to real Newstart rates in over 20 years”, in fact since 1996.
This has raised legitimate concerns that the Newstart allowance is well below the poverty line, which is an issue championed by:
- the Unemployed Workers Union,
- the Australian Council of Social Services,
- Anglicare,
- and the ABC (although that was prior to it’s current management).
Rorters! from Welfare or Multinationals?
These inadequate payments entrench poverty, inhibiting rather then aiding workforce participation. Mobility, presentation, education, literacy, and skill acquisition all cost money. Financial stress adds to social marginalisation. Bullying by the job networks and policy victimisation generates social ostracisation in the community, and also limits possibilities for the unemployed and disabled. So sorry Anthony, but I am very much inclined to believe that if anyone got a little more money out of this dysfunctional system than the government was prepaired to provide, then they deserve to keep it. Any extra money would only increase their chances of improving their lot, including their ability to contribute to the economy and to finding work. Instead of attempting to recoup $3.5 billion in alleged “welfare debts”, why is the government not energetically recouping $6 billion from the tax dodging multinationals?
What about getting a Job?
Numbers don’t lie but as the ABS knows, how they get presented matters. Apart from the financial constraints, there is the statistical improbability of finding work in any way. Roy Morgan demonstrates unemployment figures in December 2016 were 9.2%, which involves 1.186 million people. In fact, when you take into account underemployment, which has risen another 10.8%, the pool of potential job seekers rises to 2,584 million. All of these job seekers are competing for approximately just 163,100 jobs Australia wide. (Nov 2016 Dept. of Employment IVI stats.) In the worst-case scenario, there are at close to an average of 16 people for every single job in the market and that doesn’t take into account the following:
- the new year’s rush of young school leavers,
- foreign workers with reciprocal work rights,
- current workers seeking to change jobs or
- the new entrants to the unemployment lines as car manufacturing in this country vanishes.
And now, just to add to the psychological and financial pressures inherent in looking for work, the government has come up with a new strategy to inhibit your search, by occupying your time with digging up old payroll records. The news of this new tactic is ever-present. 20,000 people a week receive notices of debts – allegedly to recoup incorrect welfare payments. All of which are triggered by an automated debt recovery system, which is under intense criticism because of what is essentially, the (intentionally?) flawed logic of a computer algorithm.
Erroneous mathematics.
Centerlink’s computers (IBM machines in case you were wondering) are attempting to match tax office data with Centrelink records to determine if there are discrepancies between Centerlink financial information and Tax office records.
But an inherent incompatibility exists between these two data sources, and it is a matter of timing. Centerlink has information about its payments made fortnightly, and possibly data relevant to jobs which clients were offered and accepted. Centerlink is unlikely to be aware of the continuing circumstances of that job or subsequent ones found independently in the course of any given financial year. The tax office has only an annual summary of income. There is no breakdown into weeks, fortnights or months. There is no breakdown of pay rates, when it was specifically known they earned it, or what changes to income streams occurred in the course of the year. The tax office data is therefore incompatible with Centerlink’s data. The government is comparing apples with oranges.
Despite this, Centrelink’s algorithm takes your yearly income as reported to the ATO, and averages it over each fortnight of the year. As any primary school age statistician would recognise, an annual “average” apportionment cannot measure individual fluctuations and is a flawed measure in any given fortnight. To assumes absolute consistency for all fortnights is absurd on a number of levels. The only group that may get close to this pattern are the fully employed and even then, there are allowances, overtime, uneven hours, holidays, sick leave, RDOs, wage rises, wage falls, changes of roles, and any manner of occurrences that will alter the payroll for any individual over any given week/fortnight. Certainly, the most unstable employment group and the most likely to have variants are the unemployed. It is common sense that if you are dealing with people who move in and out of employment in any given year where they may move from poverty one fortnight to sufficiency (or if lucky, excess) the next. It is common sense that averaging their yearly income will produce inaccurate results by which to measure any given actual fortnight.
Guilty before proven Innocent!
So what does Centerlink do? They take the ACTUAL fortnightly records held by Centerlink along with any limited volunteered data and try to cross-reference it against a fortnightly averaging of annual taxation income data. The normal presumption of statistical probability would tell you the likelihood of such figures matching for this demographic, is extremely unlikely. You would have to presume the mismatches will be the most common occurrence. Any programmer (and I worked as one for most of my career) would tell you such a matching is deeply flawed. Therefore clients should be approached with the assumption of innocence. In the absence of specific information in Centerlink’s internal records for discrepancies, inquires should be made tentatively as to why there might be a prima facie case for a mismatch in numbers. The onus of proof should also be on Centerlink (and not the client), as the process is so obviously flawed. Something fully recognised internally within Centerlink, if not by the political policy makers. In the face of the inherently flawed logic of this approach, innocence till proven guilty would be the legally prudent course of action.
So what does the government decide is the best course of action? To implement a process that presumes people to be guilty (of debt) till proven innocent. 20,000 Welfare recipients a week have been receiving notices that they have 21 days to prove their “innocence”, or be hit with penalties. These include a 10 per cent debt recovery fee, jail time, a restriction on travel. The event for which they are being investigated may be anywhere up to six years in the past. Some recipients are paying up, not because they accept that they actually owe the debt, but simply because they can’t locate evidence from past years, or because they fear the repercussions of a punishing government bureaucracy. If you have ever had to deal with Centerlink or any of its private job network partners you will be well aware of how punitive they are. Surprisingly to the government – apparently – this is producing a backlash.
Flaws and error rates.
Human Services Minister, Alan Tudge, insists the automated process is not flawed and despite protests to discontinue the letters he is forging ahead with gusto. For Trudge to declare, “he wasn’t aware of anyone who was completely convinced they don’t owe money but have been given a debt notice” is either grotesque wilful ignorance or a lie in the face of a growing body of evidence otherwise. When even “Liberal Senator Eric Abetz acknowledged there seemed to be problems with the system“, then you know it has to be disastrous.
The one aspect of this (that nobody appears to be talking about) is the sheer workload this must be creating for Centerlink. Let’s assume Alan Tudge is correct that the error rate is only 20%, which is contrary to what centerlink whistle-blowers reveal is the case. Giving him the full benefit of the doubt, 20K letters a week represents 4K fraudulent claims a week. Which is 16K a month and 192K a year. After 1.04 million data matching discrepancy letters in a year, they will not even cover all the numbers of unemployed in this country (1.186 million – see above), let alone all the other welfare recipients for other reasons. Alan Trudge expects the system to “generate 1.7 million compliance notices”, which by his own estimates means at least 340,000 letters in error. Of course, the Centrelink compliance officer whistle-blower that spoke to the Guardian suggests the percentages of errors are vastly larger. Given that all of this was not only easily identifiable but unavoidably self-evident prior to the system being switched on, how is any of this not fraudulent?
Voters & workers affected.
At the current letter-writing rate (if they can maintain it) this will take over a year and a half to complete, although Mr Trudge thinks it will take 3 years. By then Australian Lawyers will be in a feeding frenzy of class action suits with minimally 340,000 clients with legitimate grievances with the government. This will presumably still be an ongoing issue by the next election. According to 2014 Centerlink data there were 14.459 million Social Services payments made in the March 2014 Quarter to 50% of the population – interestingly, a reduction from previous numbers. There are only 13.5 million voters – according to AEC – who voted in the last election. This is not a vote winner. But presuming you are not expecting to win the next election, leaving this mess on another party’s door to cleanup provides a damaging handicap. The amazingly short-term memory of the public, gives the coalition an advantageous opportunity to disparage what the next government will have to do to rectify the situation.
Putting aside the legal costs, consider then the other real cost in man-hours for Centerlink to resolve each erroneous issue when there are minimally 4000 cases a week. To keep on top of the “erroneous” case load – if Mr Trudge is correct – requires the equivalent of 105 Centerlink officers processing each claim within an hour in a 38 hour week. This presumes the ability for each officer to address, research, confirm and redress an error on each letter in one hour and do no other administrative work. There appears to be mounting evidence it takes much more time. Plus that does not factor in the equivalent of the 421 Centerlink officers devoting a single hour in a 38 hour week, that you’d need to process the claims – and not fall behind – which Mr Trudge believes are valid. But these figures are conservative. As I previously explained, the error rate is far larger according to the Guardian’s Centerlink whistle-blower. The backlog of work is just going to be extraordinary, if it isn’t already. No wonder it is so difficult to get through to Centerlink on the phone. It was nearly impossible to get Centerlink on the phone when there was only 20,000 debt recovery letters sent in a year but now that they are doing it every week …. ? As for other means of communication, even compliance officers are complaining they cannot access the Centerlink online system efficiently, let alone customers.
Opportunities or Overload?
In truth, even if Alan Trudge did put an end to it; Centrelink will probably still be spending thousands of man-hours dealing with the consequences of this flawed and fraudulent system. The same would be true if the Commonwealth Ombudsman began investigating Centrelink’s debt recovery system and put a stop to it – disregarding the costs in legal redress, which are sure to follow. Nothing about this course of action makes any logical sense, except to see this as class warfare against our vulnerable and easily disparaged citizens.
Well at least, it will probably increase employment opportunities in the community at Centerlink that will giving a few folk some extra, well sought after work. But wait, isn’t there a public service full time employment freeze?
——//——
P.S. 03/03/2017
I add this postscript because I wish to cover one of the points of mystery I’d not been able to discern. How the government (Alan Tudge in particular) could repeatedly claim Centrelink’s average wait time on a call was 12 minutes. Despite:
- when repeated anecdotal evidence said it was much longer. Statistical evidence being more credible (if collected accurately) than anecdotal.
- the government’s claims were not in accordance with the aforementioned backlog , as logically it should have been longer.
As you may be aware the Senate on the 8th of February confirmed an inquiry into the automated debt system would be launched. A Senate question raised by Labor senator Louise Pratt finally got to the bottom of this mystery on Thursday 2nd of March.
“A transfer to a new line becomes a new inquiry, and the clock would start again,” Human Services staffer Barry Jackson said during a Senate estimates hearing.
Basically by Centrelink staff transferring your call to another phone on a regular basis and only measuring time between two specific phones, then the “wait-time” is kept low. Centrelink does not measure the total time any client spends on the phone but how long you are connected to a specific phone within Centrelink.
It is a contrived and deliberate deception so Alan Tudge can make a claim that call waiting times are short.
The myth of Jobs Growth
Turnbull’s “Jobs and Growth” campaign inspired many in Australia to vote for whom they believed were the better economic managers of our economy. In the first quarter of their second term in office, Australia is showing declining growth in the economy and a similar decline in full-time jobs.
The Slave Trade
The Hebrews and Greeks regarded work as a curse because “work” was performed by slaves and the underclass. Placing a positive moral value on “work” is a relatively recent invention emerging out of the Protestant Reformation. Max Weber, a German economic sociologist, wrote the book, “The Protestant Ethic and the Spirit of Capitalism“ coining the term the “Protestant work ethic“. The concept of the religious work ethic became secularised to support the mounting new industrial system which required workers who would accept long hours and poor working conditions.
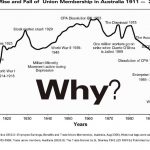
The unionism of the 19th century reshaped much of the makeup of “work” as we know it today. Consider ‘fair and reasonable’ wages (the 1907 Harvester Decision), better wages for women (as high as 54% of male wages by 1930), weekend penalty rates (from 1947), shorter working hours (down to 40 hrs in 1948) and four week holidays (from 1973). Work health and safety reforms (commencing in 1984) and more consultative supervisory styles & policies (Industrial Relations Reform Act 1993) continued to transform working relationships.
In 1996 Howard introduced the Workplace Relations Act which was later amended in 2005 (known as Work Choices). Workplace industrial relations began to change, but not necessarily for the better. Anti-union rhetoric accelerated despite as Greg Jericho noted the lack of “strong evidence that changes to the IR system will actually improve economic growth or productivity“.
Diminishing working day
The problem for many Australians is having access to paid work in the first place. A full day’s work (38 hr/weeks established in 1981) for a full day’s pay is a diminishing luxury in Australia. Full-time worker numbers are diminishing are diminishing in preference for part-time work. The “fair day’s pay” principle suffers as wages are increasingly stagnating.
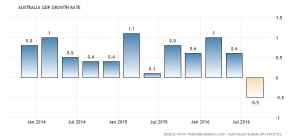
The economy’s poor performance has been reflected in the September Quarter GDP’s figures, contracting by .5%. Australia has not experienced a contraction in GDP that severe since the GFC of 2008. This result was predictable, despite the Treasurer’s rhetoric talking up the economy. While some factors affect failing economies, our poor employment record is one, as Victoria University Senior Research Fellow Janine Dixon said, “Fixing unemployment would boost production, incomes and living standards.” Into this environment came the Coalition mantra proclaiming they were the party of “Jobs and Growth” that we voted for at the beginning of this contracted quarter.
The Measures of Unemployment.
So, are we putting our growing army of eager workers, to good use to recharge our vitiated economy? The International Business Times claimed misleadingly, “From 5.7 percent in July, Australia’s unemployment rate further went down to 5.6 percent in August. It is the lowest joblessness rate since the Coalition government came to power in September 2013.” While some conservatives may claim we were back on track, it does not stand up to scrutiny. The workforce size when the LNP took power was smaller, and of course, percentages are relative to that magnitude. Using percentages hides real numbers. These are:
- ABS’s 5.6% = 697,100 people unemployed in Sept 2013 with workforce of 12,343,000
- ABS’s 5.6% = 705,100 people unemployed in Sept 2016 with workforce of 12,652,000
In term of actual numbers unemployed 5.6% in 2013, is 8000 less than 5.6% in 2016.
For the Australians that can acquire jobs, the makeup of that employment has changed. In September of 2013 full-time employment was increasing at a greater rate than part-time work but this has incurred a reversal. A trend which has not escaped international attention. As Alan Austin has pointed out in November 2016, “Over the last three years, there has been a significant shift from full-time to part-time jobs“.
To keep this critique relevant to the GDP downturn the statistics herein are pertinent to the September quarter unless otherwise stated. (October’s ABS stats for unemployment were the same and November’s worse.)
September end of quarter stats
The Australia wide Dept of Employment IVI index for job vacancies for September was 161.5K. Vacancies were down from 163.5K in August. The ratio of vacancies to unemployed was 1:4.4. However, ABS’s standard for measuring unemployment hides thousands of unemployed people as I’ve explained in a previous article. The more accurate Roy Morgan’s unemployed statistic is 1.101 million or 8.5%. The ratio is then 1:6.8! If you add their underemployment numbers, you reach 2.103 million or 16.2%, and the ratio becomes 1:13.
How then do we consider the Australia residents, who are not significantly measured by ABS as part of our workforce because of the 12/16 month rule? For example, foreign citizens with reciprocal work rights (i.e. Canadian, British, New Zealanders, etc). On October 31, 2016, there were 1,472,640 potential temporary foreign workers in Australia, 660,000 of which New Zealanders, 486,700 of which were students. Then there are the much maligned 457 visas holders in Australia, which the Dept of Immigration September Statistics number at 172,178. (Primary & secondary applicants)
What else should be accounted for here? Available vacancies examined in a report by Anglicare’s Jobs Availability Snapshot. Leon Moulden said on the nature of job vacancies showing that only 13.1% were for low skilled jobs. Applying the same maths Leon did to the vacancies available; this would represent only 21,000 vacancies Australia-wide apply to people without significant skill levels and education. The ACSF from the Board of Studies in NSW scores literacy and numeracy into five levels. The program for the International Assessment of Adult Competencies shows that 60% of people not in the labour force have competencies of less than Level 3. While people “not in the labour force” is a wider net than the unemployed, 60% of Roy Morgan’s evaluation of 1.101 million unemployed people is 660,000. While this is only a rough estimate with a significant error variant, 660K people competing for only 21K vacancies with little skill entry is a major obstacle to entry. Now to absorb any possible margin of error, I have not factored in under-employed and foreign workers.
Enough with the numbers!
Let’s now depart from the maths and discuss the sociological issues that prevent people from finding work. Some media love to amplify the perception that everyone who is unemployed, is a dole bludger, or the latest put down acronym, NEETS. It’s their dominant strategy to divide welfare from the working class without a single consideration of any other mitigating factors, such as:
- location suitability (interstate travel, home locality, & costs/inconvenience of changing residence),
- employer discrimination, (bigotry, racism & misogyny),
- accessibility limitations, (limits of public transport, car, bus, train, disability ramps, etc.),
- boundaries of literacy, skill, experience, qualifications & education levels,
- competition for jobs, (705K [smaller ABS nos. only] people writing 20 letters a month for 161.5K jobs = an average 87 applications a month per vacancy),
- financial limitations (For many surviving off the dole puts you below the poverty line),
- financial burdens (family, mortgage versus inadequate wage levels),
- injury, health & pre-existing illness or disability issues,
- occupational risks inherent in the job, (i.e. firemen, riggers)
- your status as the principal carer of a child, (i.e. single parents or guardians)
- security clearance issues (i.e. Defence Force, ASIO, child safety, commercial sensitivities),
- illegal under award payment, shockingly poor wages or condition by employers.
In summary, there are not enough jobs and the majority of available jobs are only accessible to highly skilled, mobile, and versatile workers.
Back to first principles – slavery?
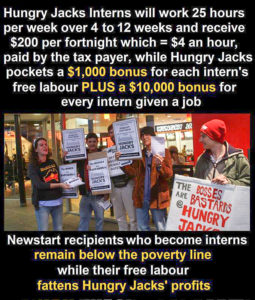
This picture isn’t yet complete. The Australian workplace for low skilled work is notorious for underpayment of wages (see 7-Eleven convenience stores, food distributors, restaurants and cafes). These are just the ones we hear about when addressed in court. Consider also those where actions are not taken, such as the Wollongong student’s vent on social media about employers paying far below award wages. But the apologists might cry, at least they are receiving some money! If you’re still of that view, then you didn’t read the last link to the concluding line which said, “Not only are employers looking for free labour, young people are putting themselves forward for unpaid work trials in the desperate hope they lead to a job“. So what has been our government’s response? An institutionalisation of the PaTH to slavery in a government underfunded internship program which I have criticised previously.
Christmas Hopes
It is nearly Christmas, and we have just had the largest fall in our GDP since December 2008. What budgetary measures can our Treasurer possibly come up with to stimulate our economy and its employment to save us from the official possibility of a recession? The next quarter ends on the 31st of this month. When 2.9903 million live below the poverty line, what real chances do people have to find a decent job with a decent wage, in the new year?
There’s been a Fall
Winter is coming!
This winter was cold apparently, and Australia slipped on the ice. No limbs were broken in the fall, but the economic dilatometer for Australia’s GDP has demonstrated contraction. Not a surprise when you consider a full range of economic indicators for the Abbott/Turnbull Government. The September quarter revealed a .5% shrinkage in our GDP, not seen since the Queensland flood affected the March 2011 quarter. The time before that was during the Global Financial Crisis. It has not been an unexpected fall given the low growth figures each of the last year’s quarters. In June 2015 quarter it was our accounting standards that defer payment recordings that recognised a 41.5% jump in government defence spending that secured a tiny growth rate. There was no defence spending finalised to save us in September 2016.
Will the Wall hold?
The Coalition team were quick to allay fears of recession, as was the media. The Treasurer blamed the deterioration on the lack of opportunity to provide tax cuts for corporations. The same corporations that by in large provide little to no tax revenue to our bounty and often relocate locally generated profits overseas. On the radio, Christopher Pyne blamed poor performance on the distraction of Australian and American elections but commented that now these were over, things would be better. What?
Build your walls higher!
The largest contributor to the fall in GDP growth according to the Australian National Accounts was the reduced output of the construction industry. Construction work had continued to tumble for the 3rd consecutive quarter taking its biggest fall of 4.9% in September’s quarter. Some are blaming poor weather (i.e. rainfall ) for a fall in building activity. Aside from the fact that we are now in the wet monsoon season meaning things will get worse, is the industry suggesting “construction” doesn’t make allowances for rain? To be fair, the Bureau of Meteorology had been reporting higher rainfalls than normal for July thru September, but it has also reported a long term decline in rainfall of around 11 per cent since the mid-1990s in April–October in the continental southeast and 19% in the southwest of Australia. Forgive me the pun, but does rainfall as an excuse, hold water? Might there be other factors in the construction downfall?
Letting “investments” through the gates.
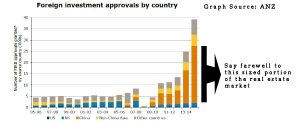
An August News article showed foreign investment approvals had shown a sharp increase in Chinese nationals particularly in the last few years. Now the previous linked News article suggested the tightening of bank lending was unlikely to affect Chinese enthusiasm for Australian real estate adversely. But is this true? Concerns about Chinese investors laundering money in the Australian housing market was exposed by the Four Corners program “The Great Wall of Money” in late 2015. Three significant events occurred in the period after this program went to air.
- Despite much procrastination because of the economic risks to the banking system, the prudential regulator of banks, APRA began to enforce some of their own rules on high-risk lending.
- Australian Banks uncovered evidence of numerous and sophisticated fraudulent income statements made by Chinese borrowers. To mitigate risks they have begun to restrict lending to offshore investors.
- The Chinese Government began cracking down on Money laundering corruption.
Three consequences have been reported in the media.
- Robert Gottliebsen reported in August that “The mass of Chinese property buyers who snapped up Australian apartments “off the plan” on the basis of a 10 per cent deposit have started to walk away from their agreements in Sydney”. Melbourne has larger volumes of Chinese buyers.
- To secure sufficient financial collateral and because banks consider development projects high-risk ventures, developers depend on being able to provide evidence to banks of “off-the-plan” purchases of apartments.
- Risk avoidance by the banks is resulting in restricting or pulling finance on the Chinese markets. This risk means construction became nonviable and added to buyer pull out; it may likely be the greater cause of any given developer may ceasing or stalling development.
While not wanting to “rain” on anyone’s parade, a more likely reason for a drop in construction might be the exit – of what was last year a massive influx of Chinese Buyers. In fact, given the huge influx of Chinese buyers in the market in 2015, it could be hypothesised that Chinese consumers were keeping our economy afloat.
Closing the gates on the wall.
So what hope is there left in the final month of this quarter for us not to discover some time in February that we are in a recession? Because two depressed GDP terms is an official recession and we have less than one month to go of the 2nd term.
- Manufacturing? – Ford is gone, Holden fired-up the final V6 motor at its Port Melbourne plant on the 29th of November and Toyota is in palliative care expecting to pass away next year.
- Renewable energy market? – The government is slashing support for that industry
- Mining? – Mining investment fell for the twelfth consecutive quarter & the seasonally adjusted estimate fell 0.8%
- Exports? – Exports of goods fell 0.3% which is a bit surprising given how cheap our dollar is.
- Retail? – This is the first decline in over three years as the seasonally adjusted estimate fell 0.8%, so perhaps that is just a glitch.
- Real estate industry services? – which fell by 2.4% which is no surprise – given the continued unaffordability of the housing market.
Industries such as Education, health, power, hospitality, transport, professional & scientific services, etc. contributed virtually nothing. So where are our economic booms?
- Information Media & Telecommunications? – rose 1.6% driven by rises in telecommunications and internet services, so be thankful for Youtube, iView, Netflix and Facebook but it’s a pity we don’t have an innovative & internationally competitive NBN.
- Farming & fishing? – driven by rises in grains, cotton and livestock production it had a 7.5% increase, so the social well-dressed participants at a BBQ with beef burgers may yet save the day.
- Finance & Insurance services? – Up by .1%, so insurance salesmen are still the best sellers around and we are still buying their spiel.
It’s either Jon Snow to the rescue or …
Unless the government can quickly pay off a huge defence “lay-by” as they did last year, it’s in your hands people. Our consistently strong industries have been Retail and Services Industries driven by household expenditures which have been traditionally strong areas of our economy. It’s Christmas, the retail and services industry awaits your patronage if you still have a job that pays a decent wage. You have one month left to buy us out of a recession. Buy up big for your kids, travel and stay in a nice motel. God help Australia, but is our last hope to avoid recession, “Santa Claus“?
Population Ponzi Scheme
Is Australia facing a crisis of overpopulation and do we have enough resources to continue to expand our numbers by bringing in more immigrants into our country? Should we persist in growing our population, allowing immigration, consuming limited resources or close our borders, therefore, limiting population growth and over-consumption? Or is there something else at play of which we are not factoring?
The Government and media often imply that increased population growth is needed to prop up growth in the economy. The premise is that economic demand is only sustainable in Australia through population growth. These adherents note that Australians are exhibiting a spiralling decline in fertility, and rising mortality and permanent departures from the country. They observe that the only reason our population grows at all is immigration. So despite our inherent xenophobia entering the public dialogue, immigration is still officially encouraged.
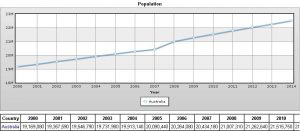
The slow total Australian population growth, courtesy of immigration, was evident in 19M in 2000 to 24M in 2016. Opponents to population growth, argue that the earth’s finite resources make it necessary to limit population growth.
Ponzi Scheme?
More radical opponents have gone as far to describe growth in population as an unsustainable “Ponzi scheme”. A Ponzi scheme is a fraudulent investment operation that pays a return to investors from new capital rather than from profit. In this case generating a new population of tax payers to support the earlier “investors” or older people. While a Ponzi scheme does not destroy anything, it does not create anything new either. Although it generates the illusion it does, eventually finite limitations prove it unsustainable, and it fails. The opponents of population growth in this country have suggested the population “Ponzi scheme” is failing and our economy is showing signs of it. They claim that the population Ponzi scheme is responsible for the failures in environmental, resourcing, consumption, borrowing, credit, homelessness, debt, food supply, health care, jobs, etc. While it is true Australia’s economic trajectory has shown a glut of economic indicators depicting downfalls in these areas, is the Ponzi scheme of population growth responsible? Is population the scapegoat that generates these downturns? Just which of these failures are the responsibility of this “scheme” or is the population Ponzi scheme argument a red herring stopping us from considering more relevant factors.
Overloading Australia
- We don’t need population growth to support a stronger taxation base to, in turn, support our ageing population.
- That we were not suffering from a skills shortage which could only be resolved through skilled immigration.
- Faith in human ingenuity is not sufficient to generate solutions to critical resource shortages.
All well-supported arguments, but will a zero growth rate change these either way? Are these issues arising from population or policies of inequality? One of the inherent faulty assumptions behind the population Ponzi hypothesis is that all people are regarded as equal consumers. Our environmental impact and consumption is anything but equal. The Ponzi arguments often overlook the role of public policy decisions which are driving inequality. The following paragraphs will illustrate where these policies make a greater contribution to unsustainable consumption, ageing population support, unaffordable housing, transport congestion, job vacancy absences and risks of recession than population demographics.
Be born, .
The SPA has mounted criticisms at Baby bonuses, child care rebates and family tax rebates because it presumes to promote population growth. Australia’s commitment to these policies has been half-hearted at best. The reality is these bonuses and rebates do not offset how expensive it is to bear children in this country. Australia’s has the world’s most expensive childcare and rising economic cost of children. So the SPA’s concerns are hyperbolic. Hence the Federal Government’s abolition of the Baby bonus among other spending cuts “reform” for families, reflects the real lack of commitment to supporting any population growth, despite their verbal claims to the contrary. Did anyone seriously imagine Peter Costello’s call to increase the birth rate with “One for Mum, one for Dad and one for the country” was a patriotic call that any family took seriously? Excuse me if I think any Treasure’s image or public “patriotic” call into the Australian bedrooms was anything of an incentive? Despite a blip in 2007/2008, our continuing experience has been the falling birth rates of the last few decades. There are a few grounds for concern here for the SPA, as the government’s efforts are lacklustre at best. On the other hand, the costs of immigration to bring in workers, to facilitate 457 visas, and even to pay them for working in our economy, is nowhere near as expensive as rearing children. Certainly, elements of corporate Australia would prefer to boost our population via this means, then use Australians, as foreigners can be bought cheaply. Abuse of visa workers is certainly not uncommon. So the question should be, is the need to boost the population to provide support for our economy, which or to facilitate exploitation and inequality?
Travel to work, .
Transportation congestion while being an issue in Australia is a product of an ideology that favours roads over public transport. The ongoing failings of planning and the dubious justifications of WestConnex’s impact on the Sydney transport are illustrative of a political ideology that is rewarding corporate road builders who donate heavily to political parties, over and above developing good public transportation. Not so much a factor of the population but a failure of political impetus to build sustainable infrastructure that should have easily met our population growth.
Borrow to Buy, .
Governments tend to favour population increases to spread the burden of public debt bond borrowings, raise revenue and stave off recession, presuming our population has the discretionary income to transact. The over-focusing on our tiny public debt (despite it growing from 10.1% to 18.3% of our GDP under the coalition), ignores the real recessionary pressures in Australia. These being credit growth and our unsustainable private debt at 123% of our GDP. While certainly a by-product of the population, perhaps we should focus on evidence-based conclusions for what debt levels we ought to be concerned about. Providing better regulation of banks to alleviate our society’s over-consumption of debt, serves Australian’s interests more than does current ideological policy.
Consume, .
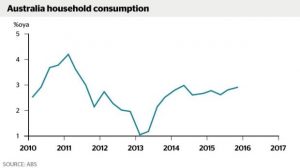
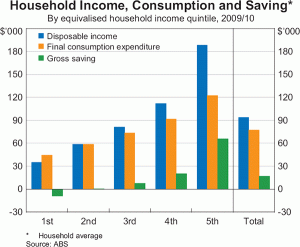
Australia has a high rate of consumption, but our household consumption is not rising at the same consistent or relative speed as the population in Australia. There are many inconsistencies generated in our entrenched poverty and social inequality in Australia. This makes the links presumed between consumption of housing and population tenuous, especially as the housing construction rate is exceeding demand needs. For example, Sydney is already a city of 90,000 unoccupied homes and Melbourne with 83,000 vacant residences. Blaming population for the risks of Recession and Housing booms/busts as suggested by Michael Janda’s ABC article ignores the effects of policies that support un-quarantined Negative Gearing Capital Gains concessions and facilitating Asian laundering of cash needs. Even where population contributes, inequality breeds erratic consumption levels and greed consumes far more than its fair share.
Invent to Sell, .
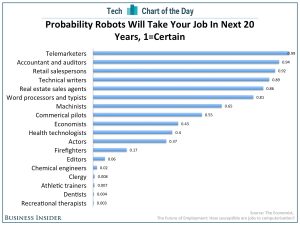
Technology is often considered labour-augmenting as it increases GDP without an accompanying growth in population. It might have been labour-augmenting in a pre-industrialised society but the onset of technological innovation is changing the playing field. Malcolm Turnbull’s “innovation nation” has an often unpredictable capacity to destroy jobs. The consequences of automation, is disappearing more jobs than outsourcing has ever done. This is evident when we consider the MIT modelling on the relationship between machine learning/technology and job decline. In fact, “Gartner Inc, the technology research firm, has predicted a third of all jobs will be lost to automation within a decade“. This technology overreach will create a shortfall in jobs often inaccurately attributed to over-population.
Produce more, ..
Despite the productivity growth over the last couple of decades in Australia, it has not been accompanied by corresponding increases in jobs and wages earnings. Technology and falling remuneration’s impact suggest, paradoxically, that the human component (population) is becoming less relevant to the emerging economic, wealth generation structures. This has implications for the assumption that GDP growth is being fuelled by population growth. Demand and need, certainly continue to exist, and to grow with increasing population, but the relationship between economic and population growths is not proportional. For economic growth to be driven by demand then there must exist a capacity for supply to meet demand. But what if supply can not be paid for, because fewer individuals hold jobs?
Work and slave, ..
Jobs earn income, and public services provision is dependent on adequate collection of income tax. Already 13.9% of Australians live below the poverty line (including 17.7% of all children). Full-time jobs are diminishing in preference to part-time positions and the top earners/corporations utilising tax avoidance means tax collection will only diminish. Internships providing unemployed labour for minimal costs favour corporations who already pay minimal tax. When population movement does not provide equitable changes in internal revenue collection for distribution into the economy then it can’t serve a population at any level.
and age to Die!
A rising life expectancy has contributed to an ageing population. The justification to pay for this through an increase in younger income earners ignores how increasingly more expensive over time children are to bear and rear. It also overlooks how the aged baby boomers actually contribute financially to the economy and the young (as even Mark O’Conner recognised). While the public purse is quite capable of supporting an ageing population, the lack of political will to do so impedes us. Solutions such as social cooperatives for aged care delivery, lifelong education, taxation on assets, corporations and superannuation are solutions we are unwilling to implement. In fact, the aged – well supported by the public purse – would result in greater spending inside our economy, in the same way as providing for the impoverished would. The ideological and political redirection generating vast inequality is more responsible for a deterioration in support for the aged, than population numbers and longer life expectancy.
What of we who Survive?
At the risk of pointing out the obvious, the ponzi accusation for Australia’s population is somewhat limited by our “surviving” population density. Australia outside of it’s capital cities has the smallest by a long shot. You probably don’t think that if you live in Sydney but then a fifth the population for our entire country lives there. Perhaps we can find a localised ponzi population effect in Sydney? Outside of our capitals you may have to move south to the Antarctica to beat Australia for a lower population density. Yes, it is a semi-desert continent and our capacity for rural production will be victim to climate change but again, the failures of government to support rural Australia should not be laid only at the door of population. So perhaps a country whose population is only .3% of the global population on 5% of the world’s land mass, the population is not the primary problem?
The real Ponzi Scheme
The ponzi scheme that is failing, is not population, but the redistribution of per capita wealth. Given no appropriate investment in infrastructure for our population to generate jobs, create wealth and hence taxes, where lies revenue growth? Instead the government is desperately fighting a rear guard action by cutting services and talking of deficits limiting redistribution. Instead they speak erroneously of inter-generational debt and budget to commit $50 Billion to reduce company taxes. This economic insistence towards trickle down economics despite all the evidence of it not working to generate any significant economic growth. Morrison’s argument that Australia is being more divided into the taxed and untaxed is only relevant where he is talking about income taxes (which as Ross Gittons points out is “only a little over half the federal taxes we pay”). What Morrison fails to observe though, is the untaxed (from his limiting perspective of taxes) occur at both ends of the income spectrum. They that pay little or no Tax who farm their profits offshore to remove it from our economy and they who are increasingly impoverished (currently 2.5M live under the poverty line), who make too little to pay income tax! It is the diminishing middle class that have a larger tax burden (although small by international standards). Cutting taxes for the wealthy reduces their contribution to any redistribution of wealth via taxation. The unwillingness of the government to re-distribute income to that portion of the population that spends the majority of their income in the economy is counter-productive to our larger national wealth. These policies are merely provisioning for the inevitable revenue winter to come.
What does matter?
Growth Rate Indicators
With many economic indicators over the past few years showing a downturn as Alan Austin has pointed out, it interesting that growth in the economy is a mantra for the conservatives. The LNP government’s assertions inherent in their three word slogan of “Jobs and Growth” presumes we are experiencing these in certain quarters. Let us begin examining a few.
Australia’s net population growth is still positive. Moving steadily from 19M in 2000 to 24M in 2016. The net populations growth by itself is the product of accumulated ebbs and flows. For example, in 2012-13 a total of 91,761 people indicated that they left Australia permanently. Many of them professionals but only half of them were actually born overseas. A concern for the department of immigration which sees it as “a loss of skills and experience as well as a loss of social investment in fields such as education, training, health services and settlement costs of immigrants”.
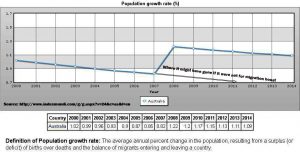
The growth rate per year although, has been decreasing over time. From it’s highest point in 2008 of 1.22% it had fallen steadily to 1.09% in 2014 according to Miguel Barrientos founder of IndexMundi. From this site other statistics from multiple sources have been garnered. Australian birth rates have been steadily dropping from 13.08 in 2000 to 12.19 per 1,000 persons in the population (per 1K/Pop) in 2014. Death rates since 2000, have been increasing as would be expected our ageing population dominating and rose to 7.07 per 1K/Pop in 2014. So why, with thousands leaving, a growing death rate and slowing birth rate do we have a steady total Australian population growth? The answer to that and the anomaly of change you may have noted between 2007 and 2008 on all the graphs, is migration. The influx in migrants, whether they be asylum seekers, visa holders or all manner of foreigners, maintain our growth. Much to the ire of many red-neck Australian “tea party” proponents who would rather we send even more “back where they came from” than the 91K we lose in a year. While the Department of Immigration is optimistic that net migration rates will increase in the future – and has published optimistic forward estimates figures – the actual historical statistics shown no such trend. Net migration rate which was at 5.74 immigrants per 1K/Pop in 2014, has been steadily decreasing since 2008 when it was 6.34. Despite the annual departures without the larger influx, the total Australian population growth might be in serious decline. Given the financial, social and intellectual contribution the likes of migrants, including asylum seekers, have proven to supply Australia, it remains economically irrational to be restricting their entrance. They don’t take jobs as that irrational argument by some protests, they create them. The example of Karen refugees making $40m worth of contributions to the economy in Nhill, Victoria, is a classic case. Spending 1.2 Billion a year to keep them in detention, when they could be boosting our economy by millions is both wasteful and sheer economic vandalism. Taken for reasons that have more to do with politics of fear mongering that is pandering to the emotional insecurity of a racist Australian population. It certainly has nothing to do with good economic management of a resource that is, desperate to be here and that we are blocking. So if we are socially & politically inhibited in using the resources of people to aid our economy, are we working well with the population we have in seeking to grow our net wealth?
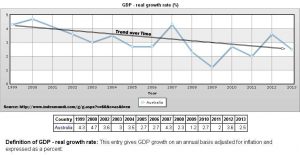
Our economic results are reported as positive news. Recent quarters have shown Australia’s economic growth has beaten expectations. This is particularly good news especially after our total GDP dipped in US dollar terms from 2013 to 2014. Unfortunately the growth rate in GDP despite numerous fluctuations, has been showing a falling trend generally since 1999. GDP per capita although, has shown a stead increase over the same time. It looks prosperous, provided you fail to account for wealth inequality.
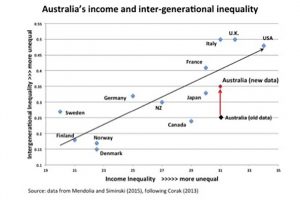
One of the noticeable absences from Joe Hockey’s Intergenerational Report (IGR) last year, was no indicator of the Gini coefficient (a normally standard reporting indicator in previous IGR’s for socio-economic impact of policies). The Australian National University has noted that wage inequality has increased steadily from early 1980s onwards [1] and ACOSS has noted an increase in numbers of citizens living below the poverty line.
Poverty numbers in Australia thrust upward to 2.55 million in 2014 (over .6 million of that being children). This continues the long-term trend of growing inequality in Australia. This factors certainly skew the per capita growth in GDP towards the already wealthy demographic.
So many conservatives hope the coalitions focus on Jobs and Growth is a progressive step in the right direction to shift the burden of growing poverty and provide jobs that can lift our limited growth population out of poverty. So are jobs the solution and have jobs increased? Scott Morrison is loudly boasting, “yes they have!” And if you want to retain that shallow positivist joy, this is where you should stop in your examination.
Participation in the labour force has continued to increase to just over 12.78 million in May 2016. It was just over 12.46 million when the coalition government came into power. Unemployment has of course increased while available jobs in the market have decreased. Jobs growth (according to the Coalition) of 300,000 since they came into power, is not actually keeping up with labour force growth, let alone expanding to overcome the decreasing population growth rate aforementioned. When you consider that we have just turned over 11 months of consistent part-time job increases measured against the fifth straight months of full-time job decreases, then it is not hard to know where the real “Jobs and Growth” are occurring.
When Scott Morrison got excited about apparent jobs growth in recent ABS statistics, he did not delve too deeply into their makeup. But isn’t any job even if it is a part-time one, at least “a job”? Probably not when it cuts you off from Newstart support but just like “Newstart”, still leaves you in poverty. The recent years have seen the rise of an unemployment problem called “the working poor”. A phenomenon where working families who are subsidised by wages, live below the poverty line. Another unique employment issue (even recognised by the Telegraph who have a reputation for a lack of sympathy for the unemployed) is the homeless but fully employed demographic. The National Coalition for the homeless claimed 44% of homeless people have jobs and that was a claim from back in 2009. Given that the ABS does not rate you as unemployed if you have worked for as much as one hour in a month, none of these homeless demographics register as “unemployed” but they do qualify as part of the “jobs growth solution” boasted about by the Liberals.
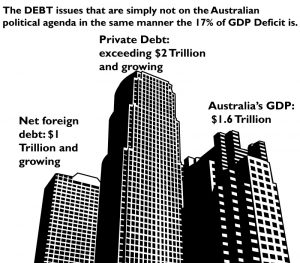
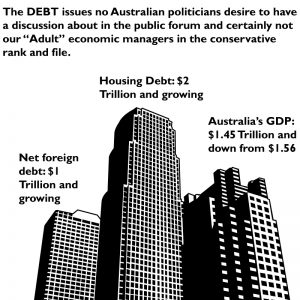
But at least if you have one of Joe Hockey’s “good” jobs (or your family needs a couple of them) and can afford a home, you have to be making some leeway? Chances are, if you are not a baby boomer who has finally paid off your home and retired, you are burdened by an enormous amounts of private debt. Millions of Australians are lumbered with housing debt. Private Debt zipped past our GDP to loom above it by over 123%. The over $2 Trillion in private debt is being chased by it’s little brother, “Foreign Debt” who has only grown to over $1 Trillion but has ambitions. Australia is already living beyond its means with faint ambitions by the average wage earner to grow their wealth.
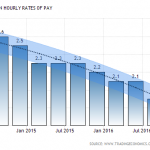
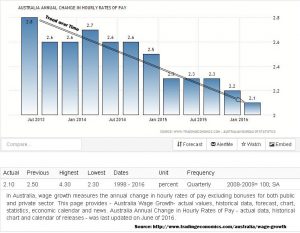
It is therefore a shame that Morrison’s “growth” part of the equation doesn’t include Australia’s hourly rates of pay. These have been steadily diminishing over the term of this government. Even the Reserve Bank has expressed their concerns over the how wage growth has declined markedly in Australia over the last few years. What has been growing at a rate that is outstripping our economic growth – that Morrison can boast about – is housing. As the global property guide proclaimed. “House prices rose by 11.4% in Australia´s eight major cities during the year to end-Q3 2015 (9.72% inflation-adjusted), up from an annual rise of 9.23% in a year earlier and the highest y-o-y increase since Q2 2010, based on figures from the Australian Bureau of Statistics.”
So in summary, Debt and housing costs are growing but wages to afford the debt and housing is not. If I were to provide advise, it would be if you have a full-time job, don’t leave it. They are vanishing and there is only growth in part-time jobs. If all you can find is a part-time job, the chances of you descending into poverty are statistically significant. Don’t live in major cities. Given there are at least 8 times the number unemployed as there are jobs in the market, your chances of getting a job,- even a part-time one – are slim to none. Australia won’t allow highly motivated foreigners – like asylum seekers – into the country to boost our economy, as they have historically proven to do over decades. In fact we would rather spend billions abusing them in offshore gulags, then give them that opportunity. This is the price of being insular and parochial. Conservatives with a reputation for a love of money would rather spend billions on locking people up when you could be exploiting them to create millions. Am I the only one that is puzzled by this? So with a slowly diminishing rate of growth for population, GDP, hourly wages, full-time employment, and innumerable other economic indicators and a rapid rise in debts, housing prices, part-time employment, poverty and inequality, has it occurred to anyone that something is wrong here?
The record of the current government is laid out in its last three years of office. On July 2nd you have a chance to ensure this continues. That choice is your’s Australia!
——–//——–
[1] “Is Inequality Increasing?”, Powerpoint Presentation for Parliamentary Library Vital Issues Seminar, 10 October 2012 by Peter Whiteford, Crawford School of Public Policy
July afterthought.
With a heavy heart, I have only one comment to add to this article in the July that followed that election.
Australia, you have failed again! <sigh>
Internships and Growth
Scott Morrison the magician, illusionist extraordinaire, has made all Australia’s failing job & economic growth problems vanish in a puff of smoke and mirrors (with apologies to John Passant for stealing his phrase). He has created a grand facade of jobs springing miraculously from the presumption of Australia’s economically fertile soil. Drought resistant and immune to the emerging heat of anthropomorphic climate change (which was provided with no new solution in the 2016 Budget) our economy is expected to blossom with “-Jobs and Growth”. Prosperity is forthcoming to the families of Australia, except for those who are too lazy to earn over $80K a year! To cheers of “Hear! Hear!” amongst his colleagues, Morrison & Turnbull supercharged the great Australian dream of owning your own home. It is now, apparently, attainable by one year’s olds and children of financially well-endowed parents throughout the land. Not earning enough, then fret not! Our unregulated “scandal-free” banks will inflate your income on their paperwork. Hence your appearance as a newly minted millionaire will allow you access to funds you never dreamed you could have, much less pay back. Foreign investors looking at the bank’s books will loan us cheap money because they are too addled by the theatrics of our slight of hand. So hoodwinked that they fail to recognise a proliferation of highly leveraged loans. They barely acknowledge that countries where much smaller housing price to personal income ratios than Australia’s, have been characterised by collapsing economies. (Australian repayment rates in Sydney are 12.2 times the median salary) These lessons from history are nothing but smoky memories. Their amnesia over housing crises that have collapsed economies previously makes these investors inept at recognising our negatively geared Ponzi scheme. Certainly, no one pays attention to the fact that Australian mortgage debt is equivalent in value to 123% of Australian GDP. In the next term under the Liberals, we will all have jobs producing wealth enough for us to continue to support this mountain of debt? Wow! Welcome to Australia, a land of magic, miracles and illusion. Let us dazzle your senses, while we pick your pocket in search of some way to raise our revenue to maintain helicopter riding politicians’ out of pocket expenses.
Budget 2016 was a menagerie of shameless self-promoting political aggrandisement and back slapping. All designed to create an illusion they have a magically restorative budget that will provide jobs for us all. But as any pundit watching a magic show wants to know, “how do they do that?” So let the revelation begin.
The unemployed begins the illusion. That much maligned 10.4% of the workforce (April Roy Morgan stats) that the ABS desperately tries to sell you like 5.7%, so you don’t understand how significant the issue is. If a Newstart recipient works for so much as an hour (paid or unpaid) in four weeks, they are no longer registered as unemployed by the ABS. They still, although, may retain dole payments because they have earned little to nothing. Unemployed people who cannot declare they are ready to work immediately, whether because of other commitments or because they are so completely in a state of dysfunction that they cannot respond, are also eliminated. Hence single parents with responsibilities to children or disabled persons moved across to Newstart, simply don’t count and are not counted. The ABS’s methodology hides the real size of the “rabbit” the Government is trying to keep under their hat.
But as Michaleia Cash would intimate, all you had to do is follow the golden Liberal “PaTH”! Announcing the unemployment solution of “internships”! That government conjuration that pays businesses $1000 to accept unemployed people to perform 25 hours of tasks for them a week. The government funds interns at below minimum wage rates. They are compensating “interns” with a surplus $100 a week. To redress that, the government cut the “newstart” base support rate in the 2016 budget. Despite the Business Council of Australia arguing “the Newstart Allowance is so low it may be bad for the economy as it prevents people finding work and risks entrenching poverty.”
Contrary to some hysteria of $4/hr that social media is alarmed about; that is the $100 incremental rate change. Given the current single person’s dole rate of $263.30 a week after adding $100, the aggregate rate represents around $14.53/hr. That valuation is nothing about which to boast. It is still well below the poverty line. It is certainly less than the legislated minimum wage that was of concern to the Business Council. All for the aspirations of the unemployed who crave a chance at ongoing work for a fair wage.
Why would not businesses take advantage of “PaTH” interns as free labour and simply churn through them? Michaelia Cash’s claim, to be able to block companies from doing that, outlines no viable strategy to accomplish this? Why might I suggest businesses will exploit interns? Because businesses already have!!
The Monthly’s Richard Cook points out: “An Interns Australia report in 2015 found 86.4% of interns surveyed were not paid or were paid below minimum wage, and 78.92% reported that their internship did not lead to paid work with the same company. This unpaid precariat accept it as part of the price (or lack of price) for this brave new world of workplace flexibility and personal entrepreneurship.”
So “internship” solves everybody’s problem! Satisfies those “communists” on the left wing of the Business Council of Australia, who want to pay unemployed youth more. The true believers on the right wing of the BCA are granted free labour for 12 weeks. All participating businesses get $1000 for each unemployed person they consume. Unemployment plummets because they have “worked” for more than one hour. The jobless vanish from the ABS’s books. Workers compensation is not required as technically; interns are branded as volunteers. The government has solved everyone’s issues in one single policy. Well except for the unemployed, that crave a real job. But then they don’t matter, as they don’t have the financial capacity to bequeath wealth as political party donations. The Rabbit has vanished, and the black hat is empty!
Magic performed! The unemployed vanish beneath the ABS cloak of invisibility. Business’s unskilled, manual labour workload disappears as the unpaid fairies at the bottom of the garden do all the work. The government has apparently found more people work as they are less unemployed. Businesses are booming as costs are down, and CEOs can award themselves higher wages. Prosperity lavished on all. The last vanishing act will be the business profits as they are stashed overseas in Panama or the Virgin Islands. And that, dear reader, is how job’s growth is performed.
Jobs and Growth – Part 2
Jobs and Growth – Part Two
As already outlined in part one of examining the mantra of the Coalition’s claim to be creating “jobs and growth”, jobs in the economy are in inadequate supply. Indeed when you consider the vast numbers of under and unemployed on record, as well as the numbers of foreigners eligible to look for and consume jobs in the market, jobs are relatively non-existent. But if there is potential for economic growth in the Australian market, albeit little hope for millions of Australians to find suitable work in the short term, then perhaps there is hope for the long term holds. Perhaps, given enough time, the Coalition – who want you to believe they pride themselves on being “THE economic managers” – can pull a “rabbit out of the hat” and grow the economy to generate more job vacancies for the unemployed to fill than the rate of expansion of the workforce. For now, they are struggling to do this.
Growth?
So, with the Coalition supposedly focusing on “Jobs and Growth”, exactly what infrastructure is the government committing to, to creating growth in our economy? There is a big focus to one of the large contributors to the LNP, of the Mining Industry. Mining reaps the benefit by our largess in revoking emissions trading and mining taxes and billions in subsidisation of fuel, exploration costs, grants and cheap loans. All of which results in profit margins well in excess than these subsidies, most of which goes overseas, as mining is 83% foreign owned. Despite the big sell of the benefits of mining by the government – which the public largely buys – the reality is quite different. Mining investments are a diminishing industry with declining jobs – now down to 2% and a negligible contribution to GDP. In fact nothing at all in the Dec 2014 quarter. As jobs were disappeared from mining, the expected pickup in Construction did not occur and had in fact begun failing us as well – as it fell 3.6% in the last December Quarter with every expectation of it continuing to weaken. Any new mines – despite exaggerated claims to the contrary by the coalition about the Adani Mine – will take up tiny numbers of our unemployed as Rod Campbell demonstrates in “The Australian”. So no growth in these industries, unless you are talking about increasing workplace deaths in which case the reintroduction of the ABCC in construction is useful. The previous regime of the ABCC saw dramatic rises in construction industry deaths under the Howard Government because of a lack of the union’s ability to enforce safety standards. There was a rapid drop off of deaths once it was abolished. This would be a small boon for employment as more workers die quickly then vacancies in the construction industry will arise more often. The uptake of the unemployed into construction will help reduce unemployment’s numbers. So while mining and construction are not growing, and is shedding employee numbers, the rollover of employees through the implementation of ABCC style legislation may be of benefit to the unemployed – should they survive the experience. It certainly has no powers to combat corruption so there must be other reasons for its existence. The government’s desire to expand this style of legislation into other industries such as the Registered Organisations Bill, would potentially expand businesses capacity to roll through the unemployed as they “dropped” off, while not necessarily contributing to the real growth of the businesses in question or addressing any union corruption issues.
Exploring other industries, we might note the government have undercut our manufacturing sector as car manufacturers will bleed 200,000 jobs and as much as $29 billion in lost economic output. The steelmaking company Arrium, which employs one in ten people in the South Australian town of Whyalla, just went into administration in April this year (2016). SPC fruit canning industry only needed a tiny fraction of the money we hand out to mining to protect the industry and jobs. The Manufacturing Worker’s Union had no success at convincing Abbott to adopt a less hard-line approach to our canneries.
RET and renewable energy changes from both Abbott and Turnbull have devastated a growing industry that had a vibrant future. This is evidenced by the progress established in multiple European countries who despite many having less sunshine & wind access than Australia, are contributing significantly to their energy needs and in Norway’s example exceeding their energy requirements from renewables.
The change from public transport initiatives to road building means people are more dependent on vehicles at a greater cost to the consumer and the environment. (Perhaps Joe Hockey will be right after all, and poor people won’t be able to afford cars) Other OECD countries have developed public transport that keeps travel costs low by the clever development of properties around the transport hubs (school, hospitals, shopping centres, etc.transport). The lack of investment in public housing in city CBDs means that disenfranchised people are more remote than ever from employment opportunities, health and education services. So no growth in transport or city building infrastructure except for the most etransportation options for the public.
Health follows wealth and employment follows education, so the inadequate or lack of infrastructure development in these areas will equate to the failure to invest in human capital. This represents appalling short-sightedness at a time when China’s tertiary sector, Singapore, South Korea and Japan (and in time, Indonesia) are making dramatic consolidations around trade and education. They are gearing their workforce up to be able to participate effectively in 21st-century technology economies while Australia’s professional full-time occupations are declining according to the Graduate Careers Survey from the CGA. As degree qualifications become more expensive, the long-term outlook is not optimistic. Integral to this is that Australia is creating an NBN system that has us ranked down from 30th in the world to 60th in internet speeds. The educational advantages of online learning specifically for a country like Australia where distance education is a pertinent need is undercut by our pathetic internet offerings. Cutting the Gonski funding for our children reduces the future level of education for our nation. It’s simply short-sighted. From education to health, the prognosis is also heart stopping. Given the reduction in funding by removing previous indexing arrangements for hospital funding to “save” $80 Billion, the Government’s commitment to health in the midst of a population with an increasing proportion of aged care needs is counter-productive. If you want your population’s retirement age to be delayed as Howard, Abbott and Hockey suggested, then you need to cater for rising health costs, not diminish them. So no growth in health and education.
Under the coalition, Australia has dismantled active market labour programs creating the ineffective “work for the dole” scheme, where people are forced to paint community halls and rake garden paths. This semi skilled meaningless busy work is not dissimilar to the enforced programs that you see in North Korea. It is, after all, a means by which people are forcibly employed at below minimum wage rates with penalties extracted for failures to comply. Perhaps a North Korean labour camp is not that big of a jump, conceptually? Neither scheme in Australia or North Korea results in fulfilling full-time work.
Tourism and Agriculture although are key growth areas for Australia. Given there are 267,000 tourism businesses in Australia 95% of which are micro businesses which outside of the casino industry and hotel and hospitality association are not broad enough to afford to donate to the Liberal Party to attract favourable considerations. Given Mining can do so; it is no surprise that it is given priority over tourism and agriculture. As the Australian Institute has pointed out: “The expansion of mining causes a contraction in non-mining industries, particularly manufacturing, tourism, agriculture and education. This results in business closures and job losses”. Recent government decisions in regards tailings dumping on the Great Barrier Reef and the Shenhua mine’s resumption of farming land in NSW bear these assumptions credit. Support for these industries by the government is certainly not a priority.
Given the history of ongoing falls in consumer and business confidence, apart from a temporary boost at the change of Coalition leadership, there has been too little evidence of worthwhile growth in Australia. In fact, if it were not for the way we account for defence spending, by only accounting for all previous payments as one lump sum presumed to be paid in total on the final instalment for an “item”, Australia’s economic outlook would be dire. Change the accounting convention to recognise the defence payments when they were made, and Australia would be officially in recession.
Unemployment is an pernicious problem not being dealt with by a government that is busy dismissing public servants and growth industries and their support mechanisms (Renewable Energy projects) and undermining manufacturing in this country and reducing funding for numerous Not-for-Profits (i.e ABC, SBS, CSIRO, the Climate Commission and dozens of expert advisory bodies). All of these resulting in massive retrenchments, increasing the stress levels of employees in these and related industries leading to the aforementioned reduction in economic growth that this country is experiencing.
So, given the coalition’s reluctance to tax the wealthy or large businesses which contribute significantly to the Liberal Party but next to nothing in taxes to the Australian people’s health, wealth, infrastructure and even employment, where will we find the revenue to support Australians? The continued reluctance to pull back the massive welfare subsidisation of such companies which contribute so little to our GDP – such as mining & construction, is deeply inegalitarian when one considers how little welfare we supply to Australians who have real financial needs. The service sector contributes 68.7% of our GDP, but where the government’s policies do either so little for or are inhibiting the non-finance segments of it, from what do we then build national revenue? An economy where it is no longer possible to raise sufficient revenue from income tax because people don’t have jobs, explains the coalitions desperate bids to reduce services to the community. “JOBS AND GROWTH” have been the mantra of the Government for the last three years, worryingly resulting in such a poor performance that we risk further economic collapse. And, in the next financial year, we may not have fully paid off the next defence purchase in time to hide the reality, that Australia, will be in a recession.