Climate change has escalated as the global average temperature has risen above the 1.5°C limit we hoped to avoid. China is responsible for 27% of global carbon dioxide emissions, according to the BBC. China is often unfairly blamed for these emissions, despite accounting for 35% of global industrial production, according to the Centre for Economic Policy Research (CEPR). Still, before we point fingers at other countries, perhaps we in Australia ought to properly evaluate our own carbon footprint, especially that which results from trade, including outsourcing our manufacturing to China and its consequential pollution.
China should not bear ultimate responsibility for the creation of non-recoverable waste resulting from what it manufactures on our behalf, due to following flawed economic principles. That ought to be allocated as Australia’s pollution. According to MIT, over 22% of China’s carbon dioxide emissions stem from net exports produced there for global consumption. These emissions are classified as “trade-embodied” because China’s exports of goods and services generate the waste on behalf of the global community.
Neoclassical economics and neoliberalism in the late 19th and 20th centuries have promoted trade liberalisation and free market economies. Unsurprisingly, in 2014, Stamford University rehashed a Hayek-inspired economic myth. It claims that advanced post-industrial economies should consider outsourcing or reorganising their secondary and primary sectors, and focusing on their tertiary sector. It was based on a three-sector economic model: primary (agricultural, mining), secondary (manufacturing), and tertiary (services). One advances from the first to the third sector, leaving each level behind.
However, increasing one trophic level of an economy at the expense of others introduces risks. If a country primarily develops its primary sector, it becomes more sensitive to changes in commodity prices, agricultural weather, and environmental deterioration. Argentina has exhibited such weaknesses. Australia has retained only a remnant of its secondary trophic levels (Manufacturing), eliminating market complexity. As Aaron Patrick in the AFR said, “Australia sells the world almost nothing, relative to total exports, that requires a degree to make.”
The Pandemic’s supply chain issues, which caused inflation due to limited manufacturing in Australia, have forced subsequent administrations to evaluate the implications of not supporting a domestic manufacturing industry. In an August 2023 speech, Industry and Science Minister Ed Husic reflected this: “Australia has the highest dependency on manufactured imports and the lowest level of manufacturing self-sufficiency of any OECD country.”
A robust primary sector can provide the raw materials required for a vital secondary industry. This, in turn, can deliver the infrastructure and technologies essential for a thriving tertiary sector, that feeds back to support the primary and secondary sectors. Internally, we now lack the necessary manufacturing infrastructure capabilities, as do many Western countries. However, no modern economy will survive without some manner of primary, secondary, and tertiary levels.
Consequently, post-industrial economic narratives have facilitated the extensive outsourcing of secondary-level manufacturing, leading to a significant decline in domestic manufacturing capabilities. The fact that 35% of global manufacturing is outsourced to China is sustaining these nations’ operational economies.
According to Climate Analytics, Australia ranks 11th in worldwide per capita carbon emissions, whereas China ranks 38th, according to Visual Capitalist. Australia accounts for 4.5% of the world’s fossil-fuel carbon dioxide emissions, excluding imports, with 80% of this total coming from fossil fuels. Woodside’s North-West Shelf operations will continue for 40 years as a consequence of the Albanese government approval. This should considerably increase the amount of waste we produce. China’s pollution-related imports should be credited to other economies. Waste by US corporations producing in China to take advantage of reduced costs and better logistics should be blamed on the US. This is often overlooked and is particularly detrimental to Australia.
The Department of Foreign Affairs and Trade reports that China’s manufactured goods exports to Australia rose 39% to $106 billion from 2019-20 to 2022-23. Australia’s largest resource and energy market is China, and related waste is a consequence of Australian consumption.
China supplied £63.6 billion to the UK in 2024, according to the BBC. Chinese goods accounted for 13.3% of UK imports, making China the top import partner. China is Australia’s greatest import and export partner. In 2024, Australia’s exports totaled $196 billion, and its imports reached $115.6 billion, according to the ABS.
When we ignore neoliberal capitalism and capital mobility that facilitates outsourcing, we fail to acknowledge their influence, and we solely attribute carbon pollution to China. China is the outsourcer for much of the secondary trophic level of several Western economies. Global supply chains and international trade make it challenging to determine which countries are the primary sources of emissions for China’s industry. We can chart the intermediary cause, not the final accountability. The graph from ‘Our World in Data’ shows ‘production-based’ emissions per capita. It does not account for imported contributions or land use.
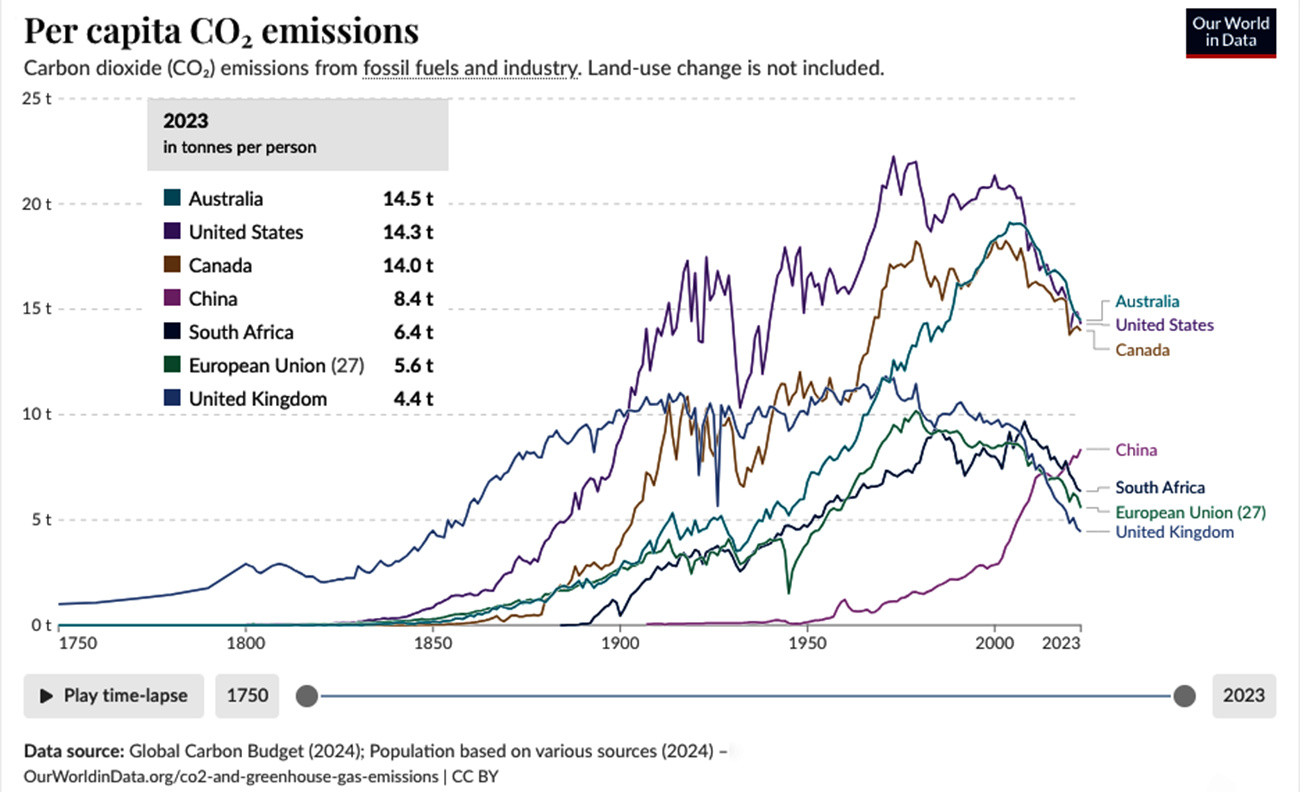
Since the Global Financial Crisis, Australia has competed with the US for the highest per capita polluter in the world (excluding “trade-embodied” pollution and land use), only falling behind in 2014 and 2022. The first was a consequence of PM, Tony Abbott reversing PM, Julia Gillard’s carbon pricing policy. The second is due to the real-world lag created by pandemic lockdowns. While we fell behind in per-capita pollution in 2022, we rebounded in 2023.
One can only imagine that if we included land use (we’ve 5% of the world’s land mass) and accounted for imported “trade-embodied” pollution ($115.6 billion in imports from China in 2024), we would hold a more convincing lead position among the world’s greatest per capita polluters. Woodside’s additional 40 years of fossil fuel extraction and exporting from the North-West Shelf are surely going to give us a commanding lead for decades to come.
Better measurements are needed for effective mitigation initiatives. My father (the perpetual accountant) often said to me, “What gets measured, gets managed!” We should include our imported carbon pollution as well as our domestic and exported use. Relevant to Australians because Western economies’ post-industrial economic mantra prefers to dismiss individual contributions and ignore collective responsibility. That failure contributes to more frequent floods, droughts, and massive fires in our country. It provides excuses to minimise our commitment to reducing consumption and addressing the need to switch to batteries and renewables as anything less than an emergency. That choice will result in loss of life, property damage, and economic penalty. We must accept responsibility for driving global temperature above 1.5 degrees, not pass the buck to a country that is manufacturing on our behalf.
References
- Australian Bureau of Statistics. (2024, April 30). International Trade: Supplementary Information, Calendar Year, 2019 | Australian Bureau of Statistics. Retrieved from www.abs.gov.au website: https://www.abs.gov.au/statistics/economy/international-trade/international-trade-supplementary-information-calendar-year/latest-release
- Baldwin, R. (2024, January 17). China Is the World’s Sole Manufacturing superpower: a Line Sketch of the Rise. Retrieved from CEPR website: https://cepr.org/voxeu/columns/china-worlds-sole-manufacturing-superpower-line-sketch-rise
- BBC. (2021, May 7). Report: China Emissions Exceed All Developed Nations Combined. BBC News. Retrieved from https://www.bbc.com/news/world-asia-57018837
- BBC. (2024, July 4). China as a regional and world power – China’s international influence – Higher Modern Studies Revision. Retrieved from BBC Bitesize website: https://www.bbc.co.uk/bitesize/guides/zvwmy9q/revision/2
- Department of Foreign Affairs and Trade. (2021). Trade statistical pivot tables. Retrieved from Australian Government Department of Foreign Affairs and Trade website: https://www.dfat.gov.au/trade/trade-and-investment-data-information-and-publications/trade-statistics/trade-statistical-pivot-tables
- Grant, H., & Hare, B. (2024, August 11). Australia’s global fossil fuel carbon footprint. Retrieved from Climate Analytics website: https://climateanalytics.org/publications/australias-global-fossil-fuel-carbon-footprint
- Haly, J. (2022, March 13). Climate change has created two very typical states of environmental disasters in the Australian landscape – The AIM Network. Retrieved from The AIM Network website: https://theaimn.com/climate-change-has-created-two-very-typical-states-of-environmental-disasters-in-the-australian-landscape/
- Husic, E. (2023, August 23). A Future Made in Australia: Deepening Australia’s Economic Complexity | Ministers for the Department of Industry, Science and Resources. Retrieved from Ministers for the Department of Industry, Science and Resources website: https://www.minister.industry.gov.au/ministers/husic/speeches/future-made-australia-deepening-australias-economic-complexity
- Nicholas, J., & Evershed, N. (2025, June 18). Revealed: the astonishing greenhouse gas emissions that will result from the North West Shelf project. Retrieved from the Guardian website: https://www.theguardian.com/news/ng-interactive/2025/jun/19/north-west-shelf-project-greenhouse-gas-emissions-burrup-peninsula-western-australia
- Our World in Data. (2024). Per capita CO2 emissions. Retrieved from Our World in Data website: https://ourworldindata.org/grapher/co-emissions-per-capita?country=USA~GBR~OWID_EU27~CHN~ZAF~CAN~AUS
- Patrick, A. (2019, October 7). Australia is rich, dumb and getting dumber. Retrieved from Australian Financial Review website: https://www.afr.com/policy/economy/australia-is-rich-dumb-and-getting-dumber-20191007-p52y8i
- Rao, P. (2025, June 5). Ranked: Top Countries by Annual Electricity Production (1985–2024). Retrieved from Visual Capitalist website: https://www.visualcapitalist.com/ranked-top-countries-by-annual-electricity-production-1985-2024/
- Readfearn, G. (2021, May 31). Covid sent Australia’s carbon emissions plummeting in 2020 to lowest levels in 30 years. Retrieved from the Guardian website: https://www.theguardian.com/environment/2021/may/31/covid-sent-australias-carbon-emissions-plummeting-in-2020-to-lowest-levels-in-30-years
- Roberts, A. G. (2014, March 6). Calculating China’s carbon emissions from trade. Retrieved from MIT News | Massachusetts Institute of Technology website: https://news.mit.edu/2014/calculating-chinas-carbon-emissions-from-trade
- Roberts, E. (2014, November 1). The Economics Behind Offshoring. Retrieved from cs.stanford.edu website: https://cs.stanford.edu/people/eroberts/cs181/projects/2003-04/offshoring/history.html
- Taylor, A. (2025, April). Why U.S. Manufacturers Can’t Quit China Despite Challenges. Retrieved from Cleverence.com website: https://www.cleverence.com/articles/business-blogs/why-u.s.-manufacturers-cant-quit-china-despite-challenges/
- The Australia Institute. (2020, August 5). Key Gillard-Era Reform Carbon Price Would Have Saved 72 Million Tonnes of Emissions. Retrieved from The Australia Institute website: https://australiainstitute.org.au/post/key-gillard-era-reform-carbon-price-would-have-saved-72-million-tonnes-of-emissions/
- Weinreich, L. (2024, October 30). Historical Responsibility for the Climate Crisis: The Roots of the Unfair Imbalance | Climate Change Performance Index. Retrieved from Climate Change Performance Index | The Climate Change Performance Index (CCPI) is a scoring system designed to enhance transparency in international climate politics. website: https://ccpi.org/historical-responsibility-for-the-climate-crisis-the-roots-of-the-unfair-imbalance/